Shiny interactive visualisation
Billy Fung / 2017-03-06
Data visualisation and verification
One of the main steps in working with data, is that you want to see what the data looks like as you adjust it. Interacting with your data is always something that is of great importance, usually in the form of plotting static graphs as you adjust parameters. With R Shiny, you are given a web application framework which allows you to create interactive applications. This means you can create a plot, and then have a slider that changes parameter values and you can see the plot changing.
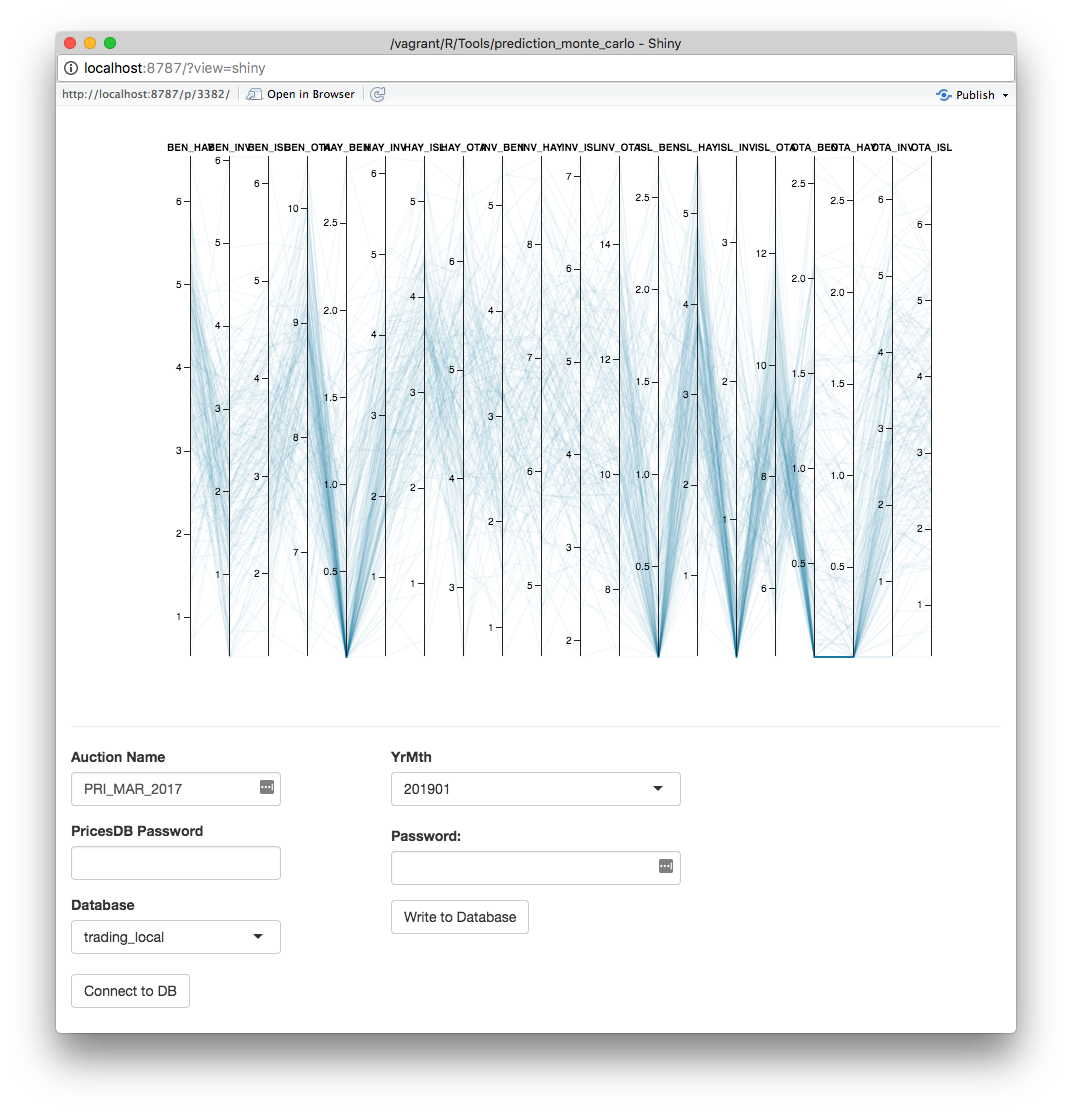
This is what R Shiny called reactivity. Essentially Shiny allows you to turn your R code into an application that adjusts values, and outputs something immediately. I will state that my purpose of using Shiny is to create wire frame prototypes quickly, and allow for functionality as quick as possible. So these apps are never in real production, except for being used internally. What I’ve been using Shiny for is for checking outputs of distributions before inputting them into our database. For example, I have a model that gives us predictions for prices, and then I build a correlated joint distribution with those point predictions. Sometimes we want to look at those distributions, and filter out certain prices that we know will never happen. Shiny let’s you do that quite easily.
How does Shiny actually work?
Often with new skills you pick up, you don’t get time to really delve into the details to figure out how stuff works. This is the case for me with R, and with Shiny as well. I learned R to quickly get stuff done, and then I learned Shiny to quickly display and share the stuff I did in R. This results in not really understanding how R, or Shiny really works. Coming from an object oriented programming language background, you have all these preconceptions as to how a programming language works, and then you get to R and sometimes it works that way, and sometimes it doesn ’t.
The gist of the Shiny process is that you have reactive objects, which is a process by which expressions are re-run when they undergo a state change. This means we can have something like:
textInput("test", label = "test input", value ="abc123"),
This is a text input, which creates an R expression with test=abc123 when
the app initialises. When the input changes, Shiny tells that expression to be
re-run, which might result in test=abc567. That is the basics of reactivity,
it re-runs the R expression when there is a state change.
The state change results in a callback being sent to the Shiny server, this is essentially the code sending a note to the server to let it know that something has changed. Callbacks are important to know about, because when you have multiple reactive objects in your application, you will want to know the order in which the R expressions are re-run. The Shiny server then flushes the queue of callbacks in order.
Debugging
One of the most useful parts I’ve found for understanding how Shiny executes
the R code, is to use browser() .
browser() allows you to interrupt your code, and then step through that
expression line by line. Although it is important to remove it after you’re
done debugging, or else you’ll find yourself wondering why your application is
hanging at a certain point.
What I’ve found with using browser() is that it let’s you understand the
flow of your code, so you can put browser() within each of your reactive
objects, so you’ll know when the code will be re-executed, in order the
understand what state your application is in.
Another useful tool is the Shiny ReactLog, which outputs a chart to visualise all the dependencies of your reactive objects.
What I still don’t understand
As applications get more complex, I’ve been looking into how to properly organize large Shiny applications. I have yet to get into a comfortable environment where my code is neat and easy to understand, instead of creating a mess of functions and reactive objects. So far I’ve found that Shiny modules are the way to go, but I have yet to really understand them in terms of my workflow.
Another thing is that I’ve found drawing out a flowchart of your process before hand is useful in figuring out which objects need to be reactive, and which ones don’t. I’ve found that I can easily put myself into a situation where I have a circular dependency between reactive expressions, and the code ends up in a state that I don’t know. This brings into mind state diagrams, where you have your data objects and know exactly what inputs and outputs there are from your application.
Something I have yet to explore, is the speed of Shiny applications, and figuring out how to optimise your R code. In some of my applications, it’s a direct port of R code, with reactive plots and inputs thrown over top to create a Shiny application quickly. Which makes me think of how Shiny handles all the validation of the R expressions, and if I had inefficiencies in the original code, then those might be compounded.