Building Correlated Distributions
more Cholesky
Billy Fung /
2017-02-22
Simulations are key
Whenever you’re dealing with economical data, the stuff that is within the finance and business realm, you will always be looking at how much money you will make or lose. This I will loosely define as the payoff of a product, say you buy $100 worth of gummy bears and the next day all the supply of gummy bears run out, and suddenly your gummy bears are worth $200. So the payoff would be $100, since you’ve made $100 essentially. When you’re dealing with prices that will fluctuate over time, you will want to be able to model what you think the price will be at a certain time.
In the field of electricity wholesale markets, often you will be trading multiple products in order to hedge the risk of your portfolio. In other to determine which products you want to buy/sell, you will need to form an educated opinion on what is going to happen in the future. One of the ways to do this is to have a payoff distribution model.
Payoff Distribution Model
I should have began this post by stating that I am by no means an expert on this matter, and all this technical jargon is pretty much whatever I think is correct. I’ve been working within the electricity industry for not a very long time, and there are still so many intricacies that I don’t know or understand. So to me, a payoff distribution model is a tool that allows you to build bespoke distributions that you use to evaluate performance and risk of your portfolio. These distributions are simulated prices for the underlying product, which can be made to contain all the correlations you desire.
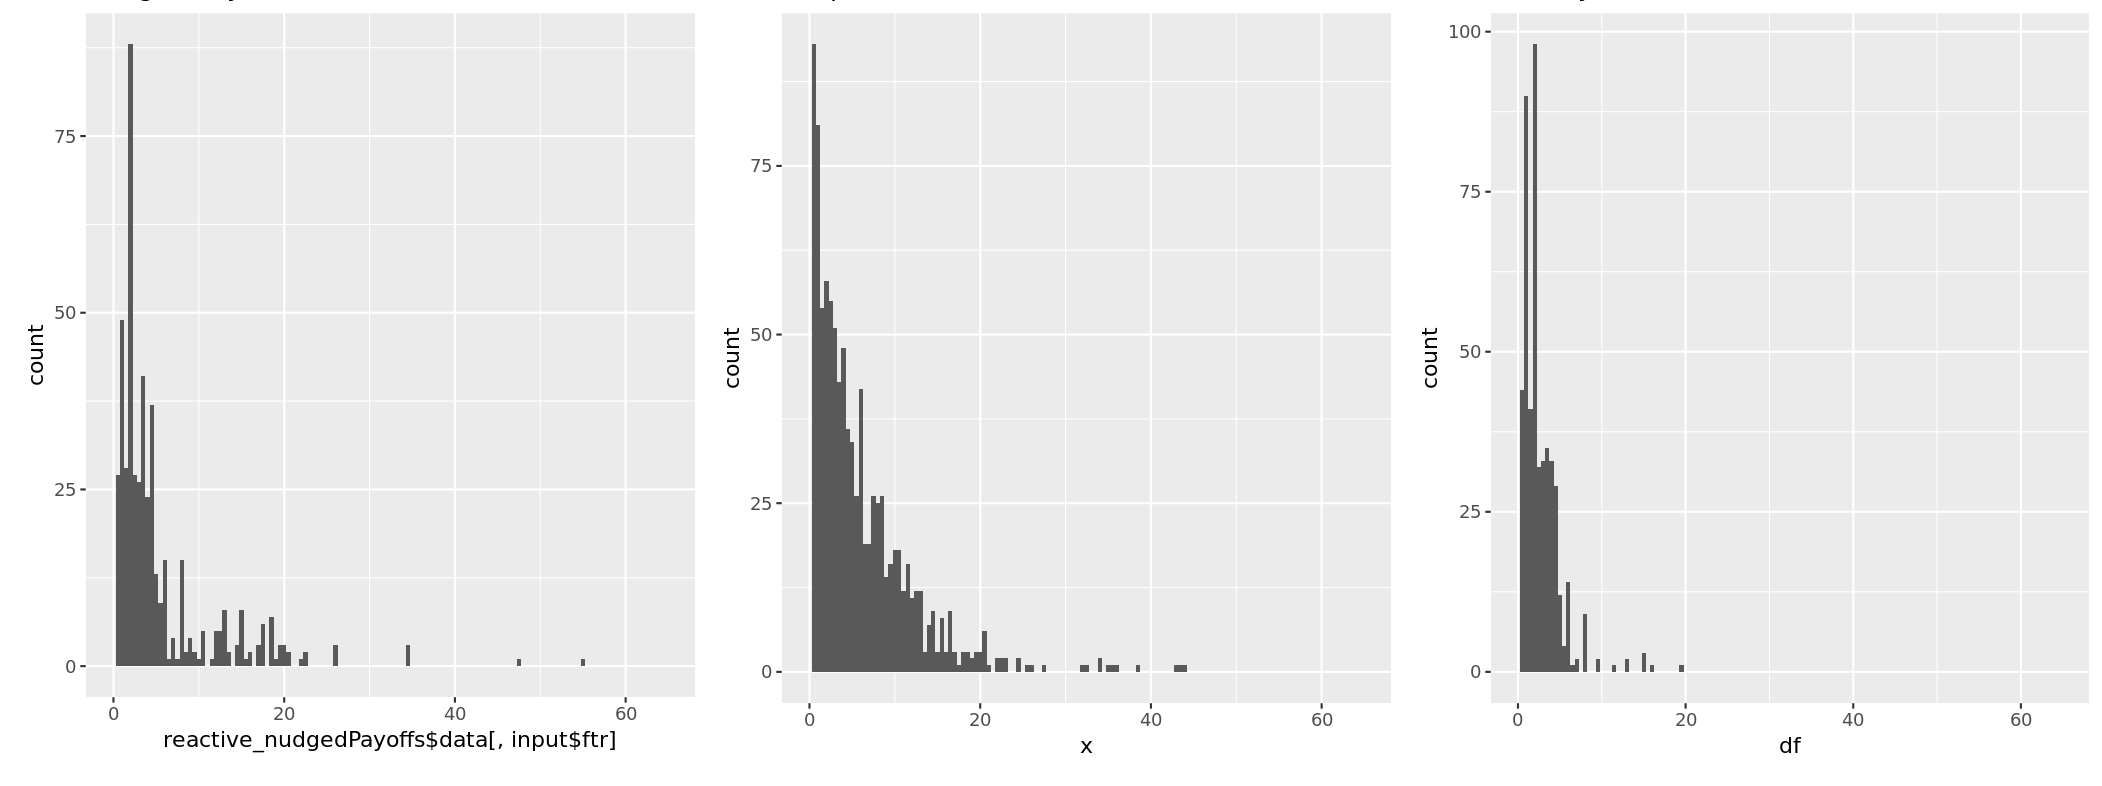
Within the New Zealand Electricity market, the FTR products are offered during 2 auctions per month, which can allow for 2 opportunities to take a bite of the apple. In order to form an opinion on what price a product might sell for in an auction, you can create a distribution of possible prices. This is where a payoff distribution model comes in. We begin with the historical distribution of payoffs for each product, which gives us a starting point for the distributions.
Keeping things correlated
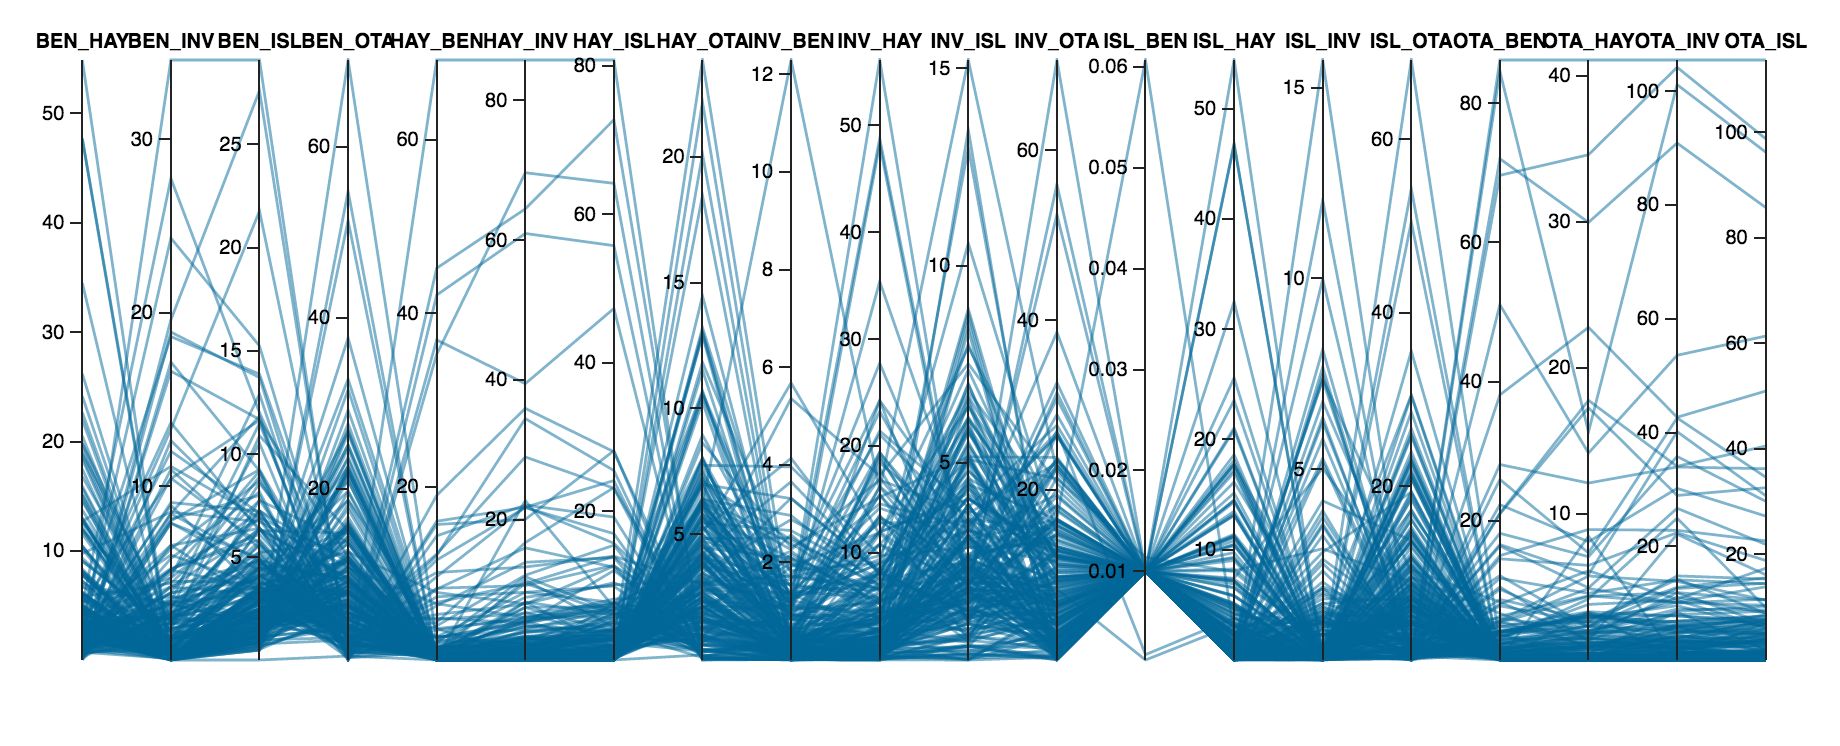
The input into the model will be the historical payoffs for each product in the auction, and the desired output will be a distribution of prices for each product. This new payoff distribution will be possible gains or losses from the result of the auction. This will give a performance measure of the total portfolio, as a combination of all the payoff distributions. Because of the nature of electricity, electrons traveling through the grid, there will always be correlation between all the FTR products.
One method to keep the correlations in tact is to sample from the historical distributions by grouping the products into clusters first. The clustering of historical payoffs can then be given labels, depending on if there is an historical event that can be attributed to those product times in history. Then for each cluster, we can adjust the probability of the event happening to each cluster. Using these adjustment values as probability weights, we can sample from the historical data to get a simulated distribution.
    distribution = sample(historical_payoffs,
                             size = 10000,
                             replace = TRUE,
                             prob = Weights)
This methodology keeps the correlation of the products since within the historical payoffs, the correlation is there. The flaws in this procedure lie in the fact that clustering doesn’t allow for custom tailored distributions for each product, but only for each cluster. This results in product payoff distributions that are not statistically detailed enough. So ideally we want to able to select each product, view the historical payoff distributions, build a target distribution, then create the resulting payoff by sampling using the target and historical distribution.
But then how do we deal with the correlations?