Exploring Titanic data
Passenger Survival
Billy Fung /
2015-11-02
Played around some more with the Titanic data
It’s a rainy weekend and my legs are tired from biking so I played with the Titanic data some more for a quick blog post. Nothing of complete substance in this post except for some graphs and a quick tree classification method. Last post I didn’t include any pretty graphs, and we all know that looking at pretty graphs is the real reason why people look at data at all. One of the easiest things to do to understand what kind of relationships might exist in the data is to plot it, so plot it I did.
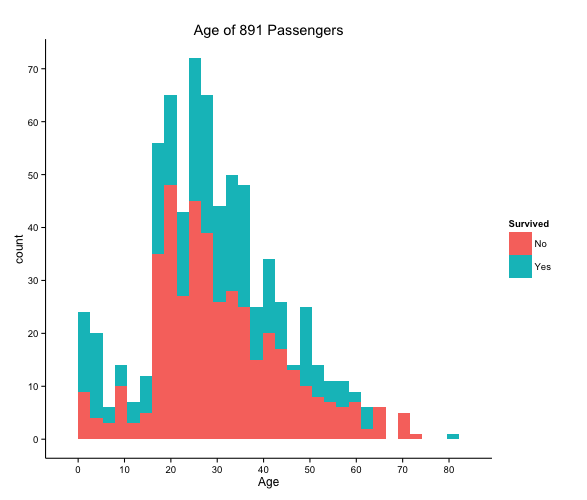
Looking at that graph we can see that majority of passengers did not survive, along with the ages of the passengers onboard the Titanic. This graph also shows that the majority of people onboard were around the ages of 20-30, and the oldest person being in the 80 category. But this graph by itself didn’t really interest me all that much so I went a bit deeper.
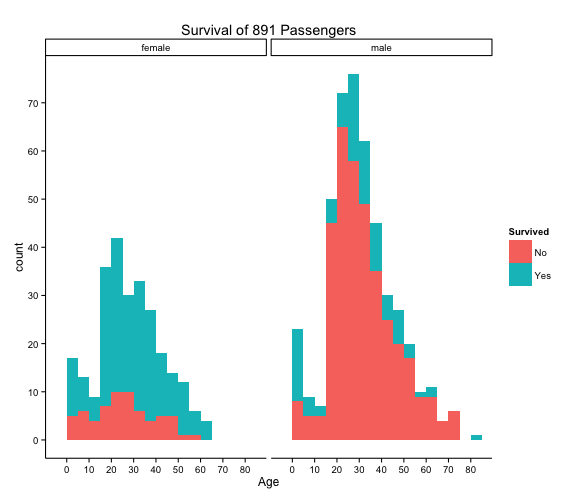
I thought it would be interesting to split the graph into male and female, maybe one gender had a better chance of surviving. Chivalry isn’t dead right? Well what do you know, the graph does show that there are a far greater percentage of females surviving.
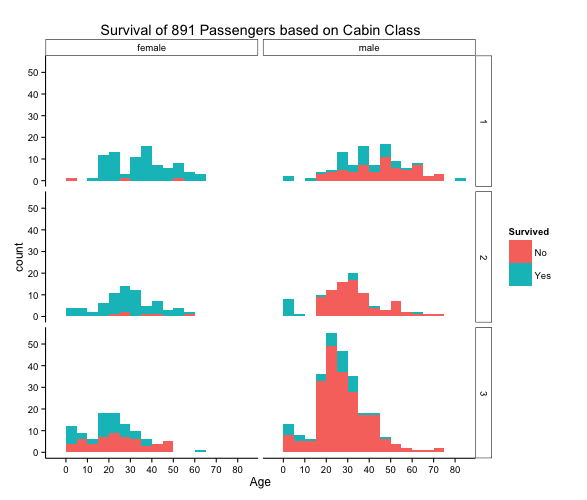
And then a final graph, I decided to break it down even further and look at the cabin class that the passengers were in. And again, this showed quite an interesting graph of the survival of passengers. Looking at the extremes, we can see that males in class 3 did not fare so well, but the females in 1st and 2nd class both had very high survival rates.
Tree classification
I know I said last time I would do improvements on the logistic regression
model I did, and do a more rigorous analysis and actually do statistics
instead of taking the lazy route. Well once again I decided to take the lazy
route and just run a quick tree classification method using random forests. I
chose to use the party package from CRAN, because who doesn’t want to party?
    rf <- cforest(Survived~Pclass+Sex+Age+Fare+SibSp+Parch,
    data=train, controls =cforest_unbiased(ntree=1000, mtry=3))
Creating the forest of decision trees is quite easy with cforest, and it allows you to set controls for the number of trees and the number of variables to initially try. With 1000 trees this ran fairly quickly and I was able to predict on the test set, and then submit. With this lazy effort of random forests, which is normally good at this type of data where a linear pattern might not have been the best, I scored an accuracy of 0.77512. This is better than the linear regression model that I did the first time. But it ’s tough to say which model will benefit more from a tidying up of data and a more rigorous selection of data. For linear regression I should be creating multiple models, looking at if there is co-linearity, and then checking each model for it’s error and significance. Whereas for trees, it’s much harder to interpret the significance of each variable. But with this problem, random forests so far have seem to be the most powerful without adjustment, because we are looking at a discrete survival value.