Python GIS first try
closest I'll get to being an astronaut
Billy Fung /
2017-08-02
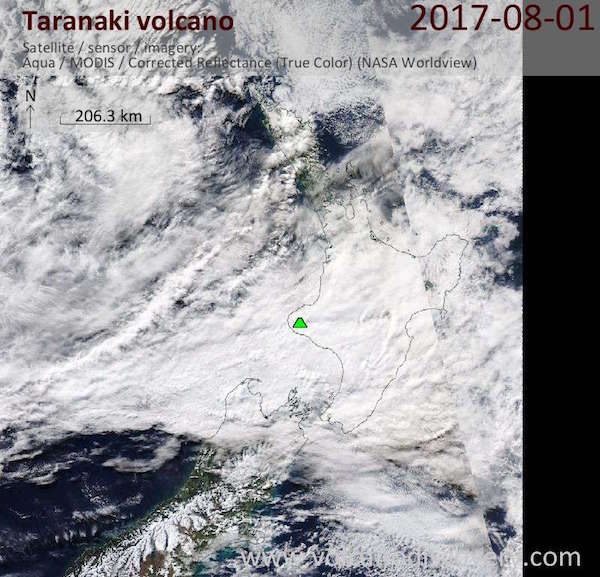
NASA MODIS data
So something I recently worked on was looking at NASA satellite images. As is with the scientific method, I was originally curious about snow cover on land in a particular area, and wondered what kind of information could be learned from looking at satellite images. A quick search lead me to the MODIS data that NASA collects, and publishes.
With snow cover information, it allows you to form a view onto how much water inflow there might be in the future. But how does one quantify snow cover? From the point of view of a satellite, looking down on an area and capturing an image, you will get:
Now how do you determine what is snow cover?
Normalized Difference Snow Index (NDSI)
Luckily we have this numerical indicator that a smart person came up with, that gives us a ratio of spectral bands over an area, which in turn gives us a ratio of how much radiation is reflected in each band. Snow absorbs short wave infrared, and cloud does not, which is the key way of determining the difference between snow and cloud. This indicator is mainly used in looking at glacier movement, being able to accurate track the effects of global warming. NASA has a publication on it of course.
Again, NASA has a great tool that allows you to select your area of interest, and then it will find corresponding tiles for you. And this is the beginning of exploring GIS. I am not knowledgeable in GIS by any means, and there is definitely a lot of room for improvement.
The data
The format of the files are HDF, which is basically just a binary file format designed to organise large amounts of data. For the MODIS files, the data structure is that of raster images, which is a matrix structure of pixels. To deal with the HDF file formats, I use the h4toh5 converter tool, to change it into a format that I can use with Python hdf library, which mainly deal with the h5 format. After all the data is in the proper format for Python, we are able to begin.
Looking at the area of interest
The first step is to only look at pixels that we care about in each tile. If you are lucky, then you might only have to look at a single tile that contains all your information. But sometimes the area you want to look at happens to need more than a single tile. The first step in grabbing the pixels of interest is to convert the MODIS projection into longitude and latitude.
I do this with the pyproj package:
    sinu = pyproj.Proj("+proj=sinu +R=6371007.181 +nadgrids=@null +wktext")
    wgs84 = pyproj.Proj("+init=EPSG:4326")
    lon, lat = pyproj.transform(sinu, wgs84, xv, yv)
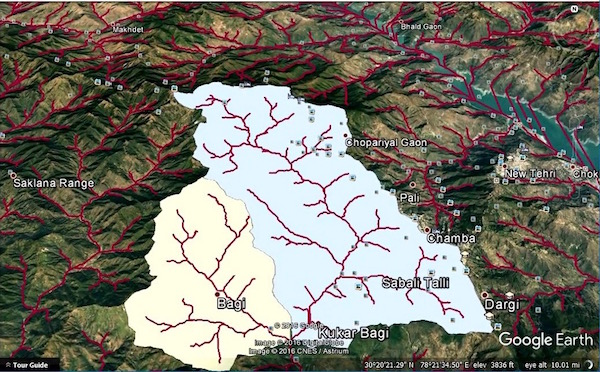
If you have a KML file, say from Google Maps or Google Earth, then you can
convert it into a numerical polygon using shapely package. Then essentially
what I’ve done is loop over all the points in a single satellite tile(s)
lon/lat and check if it falls within the shape of interest, and output a 2D
numpy array that indicates whether or not that pixel is one we care about.
This gives us a masking layer to apply over the satellite images
Extracting pixels of interest
With the mask layer is effectively a filter, letting us extract pixels that we care about from each satellite image. The task is then to grab the NDSI values from the tile for the pixel that falls within our area of interest.
The rest of the steps involve doing smoothing and clustering, and then finally some averaging to give an output NDSI factor for a particular area of interest.
Packages used
    import h5py
    import pyproj
    import keytree
    import numpy as np
    import psycopg2
    from scipy import interpolate
    from shapely.geometry import box, shape
    from astropy.convolution import convolve, Gaussian2DKernel
    from sklearn.cluster import KMeans, AgglomerativeClustering, MiniBatchKMeans
    from sklearn.preprocessing import scale

    import matplotlib as mpl
    import matplotlib.pyplot as plt
    from mpl_toolkits.basemap import Basemap
Some of these will require local distributions, I did this all in Linux, so
apt-get got me all the packages I needed.
Improvements
Is this the best way of solving the task I had? I’m not totally sure, I learned about PostGIS and spatial indexing recently, and it seems like a pretty useful tool, although maybe not needed in my application. The slowest part of my Python script is when I was extracting and processing pixels from each tile, so some improvements could be made there.
All in all, it was a fun exercise and it’s pretty neat being able to play with map objects.