Hedging and Arbitrage
Billy Fung / 2017-06-19
Making a win-win situation
Whenever you make a trade, you enter into it with some risk, risk of losing or gaining money. Hedging is essentially making sure you keep that risk as low as possible, so maybe when you win you don’t win as much, but you won’t also lose as much. The goal is to try to keep risk as low as possible, while maximising gain.
Within most markets, there will be products that are correlated, meaning the pair of prices move together, be it negatively correlated where when one goes up, the other goes down. Or positively correlated where they both go up together. By finding these pairs, you can effectively form a view on where the price will go, and then make trades accordingly.
Searching for the one(s)
Most of the difficulty in hedging lies in understanding the market, and finding which products will actually move according to your theory. While I have no expertise within financial markets, with electricity markets the fact that there is a physical grid provides insight into where to start looking. Nodal pricing markets have network losses and constraints, and often nodal markets will have products that help hedge against this risk. Long story short, these products, called FTRs provide a vehicle for hedging your risk in the futures market.
When you have 1 FTR, and 1 Future, you hold them for the purpose of being able to manage your risk if the spot price happens to rise, you will be covered in the FTR. To make a trade, you want to form a view on where the market will move, if you know that the futures will trade at price X, and the FTRs will clear at Y price, then you can ask the question of what you want to sell and buy.
Factors/Features
When dealing with the grid, you want to look for certain behaviors that might enhance a hedge pair relationship. Often looking at historical data, you might be able to spot large changes to the market that might separate the data into different regimes.
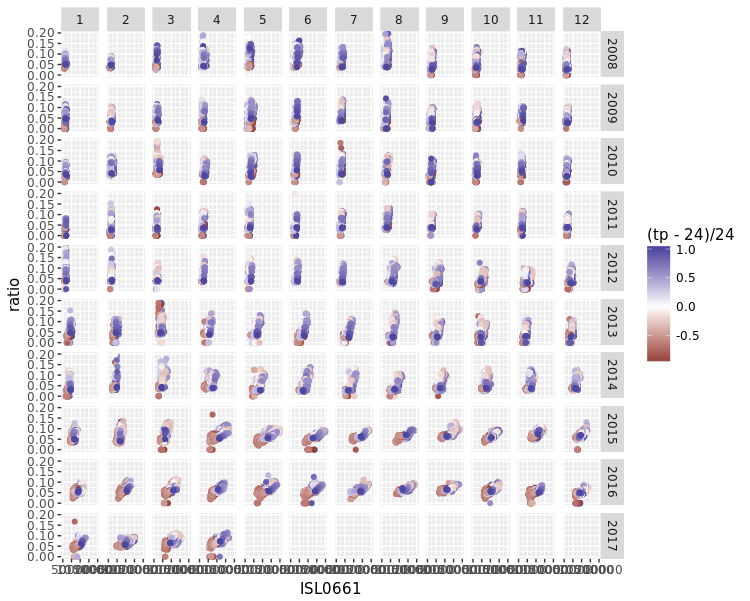
Sometimes you have to make a very large plot to see the behaviors change over time, usually it’s bad practice to do this but I couldn’t think of a better way to visualise it. But on a large screen, some changes are more obvious than others, and it let’s you prune down the dataset to certain regimes.
The general process is to look at the dataset as a whole, use your findings to subset the data into smaller datasets.