Strava Analysis
How active was I?
Billy Fung /
2015-10-06
Strava Analysis
So I decided to play around with exporting my strava files and importing it into R. The strava export is a download that gives you a whole bunch of .gpx files, which is a varietal of XML. I used python to parse the XML and batch file process all the .gpx files to grab the dates of each activity and created a .csv file with them.
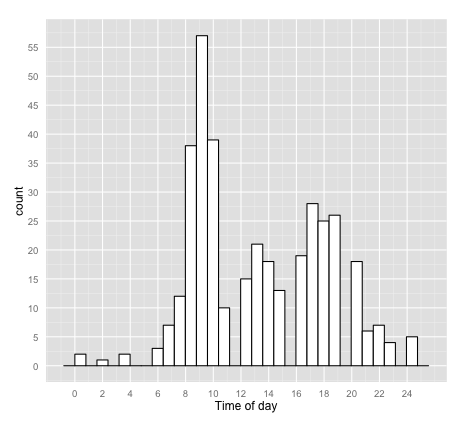
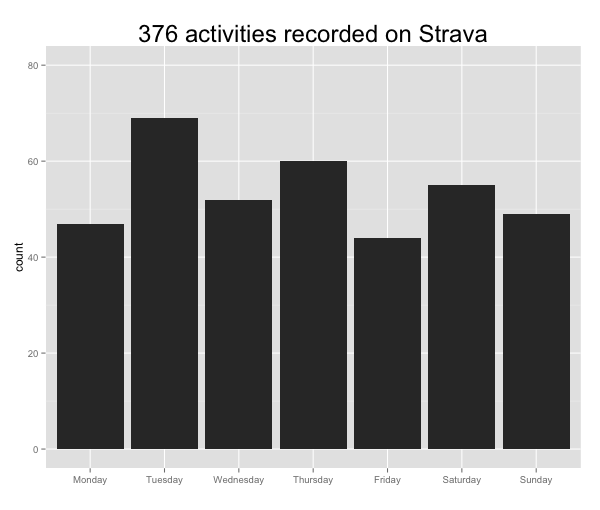
Then it was easily imported into R and a dataframe was created with the dates in the format of 2011-07-04 18:57:46. I used the lubridate package to make it easier to work with date formats, and split the original observation into day of the week and time of day, in decimal form. From there I used ggplot2 to plot the histograms showing what day I most frequently ride my bike, and the range of times at which I ride my bike.
These 376 activities are over the past 2 years, and I was surprised to see that Tuesdays are most frequent. The time of day makes sense because I was commuting to school at around 8-10am everyday, and my weekend rides also started around that time. It is funny to see the couple times I rode my bike past midnight, definitely the times I was at school till the wee hours working on projects.
I am interested in seeing the average duration of my activities, so I will most likely write another python script to grab the start and end times from the gpx files.